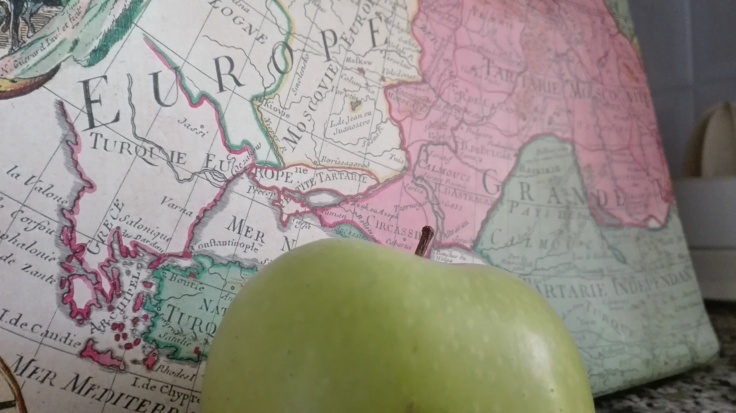
Buscar

Tuttifrutti

"A blog for documenting the work of our group in the course #SOyER16 at the UM."

mes

febrero 2016

MAP PROJECTIONS REFERENCES

Mathigon. (2010). Treasure Hunt. Retrieved from https://www.stem.org.uk/elibrary/resource/32645/treasure-hunt


Twila Brase. (2005). “Super Size Me”. Retrieved from http://www.cchfreedom.org/cchf.php/33#.Vs-K13bMtYf


Samuel Goldwyn Films. (2004). Super Size Me (videorecording), from https://www.youtube.com/watch?v=I1Lkyb6SU5U


The Prickles. (2016). The Prickles, from http://theprickles.blogspot.com.es/2016/02/feeling-like-star-or-at-least-trying-to.htmlhttp://theprickles.blogspot.com.es/2016/02/feeling-like-star-or-at-least-trying-to.html


Bussiness Dictionary. (2015). Promotional Message, from http://www.businessdictionary.com/definition/promotional-message.html


The Center For Media and Destiny (2016, February) , from http://www.mediaanddestiny.org/media-technology-not-neutral/


Wikipedia (2016, 25 January) Map Projection. Retrieved from https://en.wikipedia.org/wiki/Map_projection


Warlick, D. Scavenger Hunts. Retrieved From https://literacymatters.wikispaces.com/Scavenger+Hunts


Wikipedia (2012, June). Scavenger Hunts. Retrieved from https://en.wikipedia.org/wiki/Scavenger_hunt


Wikipedia (2012, 20 October). Distortion: Revision history. Retrieved from https://en.wikipedia.org/wiki/Distortion


The Arthur H. Map Library. The Robinson Projection. From http://www.geography.wisc.edu/maplib/robinson_projection.php


Our strategy with task 2

At the beginning of the task, I decided to divide it in three parts: some of us looked for information about the maps, others about what was treasure hunt and others and the last group had to search a media used in classes and which distorted the reality. I also said them that when we finished we had to tell to the rest of the group and to explain concepts, examples,… and whatever they read. I thought this method was the best to seek information about all topics faster and to have an idea of all to do together the full work.

Cartographic projection, reflection

In our second activity we have to talk about cartographic map.

It was so difficult for us because we didn´t know nothing about this.

On monday class the teacher explained us how we had to do the task. She said that the cartographic map could be useful for us because it will help us to see the different explanations and controversies between a lot of things, in this case the way to see the world. Doing the task we have seen that depends of the author, the same country in the map was different.

We did a power point to can explain in class our task, we met on tuesday and we did the work very fast. First we followed the instructions which the teacher gave us and then when all of us finished,we started to do the power point.

I have to say that it wasn´t easy because we thought so different.

We wanted doing the power point because we thought that these was the best way to explained us to our class and that way, ours classmates could understand us.

Finally, we have discovered that all of this served us to can explain our students the different situation in the real world, and it has been useful for us because now we know the truth.

The best moment of the week was when we finished the work because during the first two days we have to work a lot.

In my opinion the worst moment was the exposition because our power point failed and we were so nervous, besides our stars were nervous and they made some mistakes in their explanation.

Our teacher said us bad things about our task, for example she said that the power point didn´t have enough information,she said that our stars needed practise more in the next sesion.

As a analyst I know that we need to improve and to the next week we work a lot to improve.

We have learned the importance of contrast information of different sources before teaching. It´s very important to students because of that they will know the reality point of view in different ways.

In our task we put as example the different situation between woman and men in jobs. We looked in a primary book and we saw some pictures and in total there was eight pictures and six of them were pictures of man workers and the rest was woman.

In nowadays we can´t permit this distorssion in our society.

We need to conserve as a group our good relation between us and I think that the way to distribute in parts the task and definetely we need to improve the way to presen tour work in class and check our notes before the exposition.

This is related with the majority of things that we saw during all our academic life because we have seen a lot of examples of this deformation of reality, in the school books, in the map which teacher put on the blackboard…

Also we can see a lot of examples of this deformation of the reality in media for example, when we saw news on tv and then on internet where the information is different.

Finally we have understood that this task has been useful to our future life as a teachers. We should teach in a correct way and then our students will show grattitude to us.

Treasure Hunt: cartographic projections

Map projections

Map projections are the ways of representing the world on a flat map and there are different types, some of them are Robinson, Mercator and Azimuthal projection.

In the following pictures are described their main characteristics.

El pase de diapositivas requiere JavaScript.

A Earth’s globe is the only “perfect” representation of the Earth’s surface. All maps are distorted in four major ways. The four ways maps are distorted is by the shape, direction, area, and distance of the landmasses being mapped. In order to make maps, projections must be made, and different projections require different distortions.

Comparison between countries: Finland and Argentina

We have chosen Finland and Argentina because they are northern and southern countries, that is where you can actually see a major distortion. Finland has 337.000 km2 and Argentina has 2.780.400 km2, so Argentina is eight times bigger than Finland.

In Robinson’s projection, Argentina is slightly curved to the left, because the distortion is bigger as you distance from the centre. On the other hand, Finland is a little bit distorted to the Northeast for the same reason. Because of that, we see this country smaller than what it really is. In this map projection, Finland seems less important because it is more difficult to find it than Argentina, although both are in near to the poles.

In Mercator’s projection, the South of Argentina is more distorted than the North, and Finland, as is in the North, it also appears more extended that in the reality. This is because the distortion gets bigger as you distance from the equator.Like the central point is Europe, Finland is more emphasized than Argentina.

Finally, in Azimuthal projection Argentina is totally distorted in both width and length, while Finland is less distorted, in the width more than in the length. This is because the reference point is in the North, and as you distance from it, distortion will be bigger, as sizes will increment.In Azimuthal projection we find the center on the North Pole, so Finland seems more important than Argentina.

Decision about cartographic projections

As we didn’t know which map projection could be the best, we debated about it because we were not sure if chose Robinson or Mercator. At the end, we concluded that we will use a type or another depending of the age, because when children are younger they haven’t developed spatial vision so it will be better a map projection that seems more straight like Mercator. However, we think when they grow up and they are older the best option would be Robinson because they can start to relate it with the shape of the Earth. Furthermore, like they have seen two different ways of maps they could compare them and be more critic.  

Examples

Media

An example of a distortion of knowledge in schools, and so, reality in general, could be textbooks. Textbooks are an obvious educational tool that almost every student use at school. It’s the reference item for teachers, and has even devalued them in a sense that they don’t control neither the subject and content, but just follow them without even questioning. This can be a problem, as textbooks will never be neutral and accurate. It’s impossible to be 100% neutral and don’t reflect your point of view, something that is really dangerous in education, as you are supposed to transmit a neutral content for students to form their own critical and subjective view of it. Also, as we studied in PLANIFICACION, textbooks are a simple distortion of reality, as they have to simplify  concepts for children to understand them, and they simplify them so much that at the end they’re just caricatures of themselves, and don’t really represent reality. Because of that, teachers need to be aware of the ideology of textbooks, and not let them guide the course, but use them just as a support to go deeper in the content. Some children, as they are ruled by the authority principle, tend to think that everything that is in the book is ok, and that’s something the teacher must be aware of. We could solve it by not having textbooks, and instead having documents of different sources to contrast information, or using them just like a help for the teacher. They also have to put things and concepts in practice for children to see their use.

Here we have some examples related with gender and jobs. In the first picture we can see that most of the workers are men, so children can understand that the most of the women don’t work. Furthermore, in the second picture we also appreciate that the hard jobs or jobs in which is needed the strength are made by men, while women seem to be more relaxed in their jobs.

Treasure Hunt

A treasure hunt is a game that consists on providing to children a list with different items and what they have to do is to search for all the items to complete the list. An example of this activity is Internet scavenger hunt, that is a way of teaching how obtain information from Internet and what students have to do is to search in the different webs provided in the list a certain information. Other example and the one we find with primary content is a Maths scavenger hunt. In this case students will solve the different maths problems we give to them. The following pictures are about the Maths scavenger hunt and we find it in this webHowever, in the page you have to register if you want to see it, so we prepared a link of Google Drive to make easier see it.

Relationship between the activity and ‘Media are not neutral’.

We’ve studied this whole map and projections idea because its distortions of the real size of the world represents the way in which resources aren’t completely accurate at the time of representing reality. That means that teachers have to be very critical at the time of choosing media for teaching in a classroom, as they distort reality.


A week as stars

María Teresa: On monday, Ana and me, knew that our role was going to be stars. On tuesday morning, when we had our work finished, we decided to meet after lunch to prepare our exposition. It was a busy day. Next day, we were nervous, because it was our first presentation. Furthermore, we wanted to be one of the first to expound, so when Linda told us to choose a number to decide the order of presentation, we got anxious.  At the end, we were relaxed because we presented the fourth and we made a good presentation, in spite of small mistakes.

Ana: For me, the presentation has been a good training to talk in public and to practice my english. At the time of our exposition, I knew very well the content, but I got very nervous because I had to talk in front of my classmates.  It has served me for next expositions in others subjects and also to know my mistakes, so next time I can take them into account, like pronounciation.

Map projection, main concepts

Map Projection is a technique that transforms the latitudes and longitudes of locations on the surface of a sphere in order to represent the Earth´s curved surface on a flat map. This technique is useful and necessary for creating maps. There are some different map projections, some are designed for a specific purpose and distort the data differently. Some projections minimize distortions in some properties at the expense of maximizing errors in others.  In addition, «map projection» refers specifically to a cartographic projection.

Internet scavenger hunt is a tool for teaching students how to learn to obtain and use information and resources available on the Internet, while improving their reading and comprehension skills. Students have to answer a list of questions or solve problems and at the same time they practice information seeking skills. The goal is to be the first to complete the list, but there are different ways of doing it, as it can be completing tasks on the list in the most creative way. Questions´type depends on the age and skill level of students. At the end of the task, here also appears “the grand question”, it answer does not appear in websites that they have visited before, they have to incorporate what they have learned during the search. Participants can win prizes if they solve correctly puzzles to win treasure hunts.

Distortion is the alteration of an original characteristic (or other characteristic) of something, such as an object, image, sound, or any content. Some people find it useful for themselves, but actually it is unwanted. In education it is a bad tool because teachers use to teach the content in an incorrect way, so children learn some issues in a distorted way. Some textbooks are distorted and it influences to the education of children. Some books show an ideology and racist or male chauvinistic perspective, among others.

Media is the collective communication tools that are used to store and deliver information or data. News, education, entertainment, data or promotional messages are disseminated. It is associated with communication media or other medium such as newspapers television, radio,telephone and internet. People should realize that media is not neutral. For example, in education, textbooks are a simple distortion of reality, as they have to simplify concepts for children to understand them, and they simplify them so much that at the end they’re just caricatures of themselves, and don’t really represent reality. Some children tend to think that everything that is in the book is ok, and that’s something the teacher must be aware of. We could solve it by not having textbooks, and instead having documents of different sources to contrast information, or using them just like a help for the teacher.

•The Robinson projection was created in 1963 by Arthur Robinson. It is a projection of a world map that shows the world. The objective was to find a good consensus to the problem of showing the globe in a shot image. It has got some distortion as the meridians are curved in a light way, avoiding extremes, but poles are stretched in long lines instead of being spots; shapes are distorted more than they would be in a truly conformal projection.

Post review – «the prickles’

I was looking through my mates’ blog posts to get inspiration for our own, or just for seeing how they had developed theirs last week and found one that I really liked. It was an entrance called «Feeling like a star or at least trying to«, from «The prickles» blog. It captivated me from the first time and I couldn’t help but keeping on reading, even though it wasn’t an interesting topic, but just a chronicle about Juan’s experience like the star of the group. 

Firstly, I find it interesting because I think he was a really good star last week and I wanted to know how he did it to be so fluent and captivating. Also, we didn’t have any post on our blog about that role last week, as we didn’t knew it had to be reflected, and finally it was really good narrated and creative, as he dared to put funny gifs in the post. 

This mixture of creativity, good expression, fluency and funny content made me jealous of them (in a good way), and gave me ideas as well as showing me that we don’t need to be that «correct» or academically perfect to be good, and that some times it’s ok to get out of the barriers. 

«»Super size me» is a super-sized distortion of reality, not a documentary». – post review

I was creeping on the Internet, looking for a good example of this week’s assignment (the effects of projections as a distortion of reality), when I found this article, which I think is really interesting for understanding better the way in which some media distort reality for their own profit.

«»Super size me» is a super-sized distortion of reality, not a documentary«, is an article in which a health professional discusses the academy award winner documentary «super size me«. In this documentary, you can see the life of a man that, during 30 days only eats McDonald’s food, without doing exercise or consulting a nutricionist or doctor. By far, it was ok, but the public debate started when the director of the documentary started a campaign for showing it as an educational resource all over the US.

What the author of the article criticises is the fact that that documentary shouldn’t be showed in schools, as it doesn’t really show an accurate perspective of nutrition, and only blames the burger company for something, he says, was his own choice. He also argues the fact that it doesn’t represents reality in a sense that no one  would like a life like that, as everybody likes variety of food, and that eating fast food isn’t unhealthy if you combine it with sports and more kinds of aliments. 

This is a great example of the way in which people, in this case the director of the film, manipulates reality in a way that people see what they want them to see, instead of the truth. However, this topic is very subjective, because sometimes there’s not a clear reality or truth, but just visions of it, but we, as teachers, have to be very aware of what content we show in our class, as it will have a big influence on the world (even bigger than with adults, as they’re in a maturation process). Because of that, I think, we should show different opinions and contrast various sources of information in order to develop a critical view of the world in children.

A week on projections

IMG_20160225_174210.jpg

The first day, our teacher Linda explained what our work was going to be about. For us, it was kind of scary, as we still didn’t have any feedback from the previous week and didn’t know what to expect.

Finally, she told us what our week assignment was. On that moment, we were a little bit confused, as some members didn’t understand what it consisted of. Then, we assigned the roles jerarchickly and relaxed a little bit, as we started to search for information and realised it was a really interesting and easy topic. This exact day we divided our work and individually searched for infromation at home about the different types of map.

The next day, we met for each one to explain the rest its part and solved doubts that we had to make sure everyone understood everything. Then, together, we choose the countries we wanted to compare, and discussed everything about the work, such as its different sizes according to the map or the one we’d choose for our class. Finally, stars met to organise and train the presentation.

On Wednesday, we went to class and saw the presentations of our mates. We were really nervous, because last time we had a lot of mistakes, so we were scared that the same thing happened again, but finally  we did it and we could see that we improved quite a lot. There were some problems with the presentation, as we couldn’t remember that there were two files, and our stars got nervous so one of them forgot to say one part, as well as read the paper even though she knew it perfectly.

Then, when we finished presenting we noted the mistakes that our teacher said we had and improved our work. Finally, the last two days each member of the group developed its role in the blog, following the notations of our teacher in the previous one to improve and hoped for the best to come.

Crea un blog o un sitio web gratuitos con WordPress.com.

Subir ↑